Over the last 15 years, Alimentation Couche-Tard spent about $17.5B acquiring convenience stores through 100s of deals. Investing in acquisitions accounted for just under half of the cash from operations that Couche-Tard generated and contributed significantly to The Company’s greater than ten fold increase in net income over that time.
My goals are in this short write-up are to (1) review Couche-Tard’s acquisitions. I look at the activity year over year, by deal count, deal type, total spend and as percentages of cash from operations. (2) Next, I focus on three of Couche Tard’s biggest deals, recasting headline multiples by incorporating cost synergies, disposals and capital structure improvements. (3) Last, I look ahead. What does this acquisition machine look like over the next few years? What about the rest of the business? How should that impact or view of the stonk?
Table of Contents:
Deals, Deals, Deals; Meta-Analysis of Couche-Tard’s Deals
Don’t Let the Headline Fool Ya! Three Big Deals
Deal or No Deal: Looking Ahead
This write-up is data-driven. In their publicly available financial reporting, Couche-Tard shares many details of their acquisitions, providing a thorough view of their activity as a whole and of their large deals.
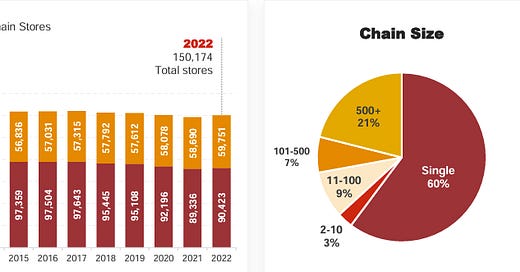
Before getting into, I share a graphic, above, from Couche-Tard’s corporate presentation. The graphic depicts the convenience store market structure in the United States. 60% of convenience stores are single location businesses, 21% are businesses with greater than 500 locations and 19% operate between two and 500 locations. Scale economies, which we’ll unpack below, and a fragmented industry both suggest consolidation has a long runway ahead. And that’s just American convenience stores. Couche-Tard’s store base is more than 50% outside of America…
Programming note: The Company’s fiscal year ends in April. As an example, Couche-Tard’s FY2024 runs from May 1st, 2023 through April 30th, 2024. My data and analysis goes back as far as FY2010.
1. Deals, Deals, Deals: Meta Analysis of Couche-Tard’s Deals
In this first section we’re going to unpack Couche-Tard’s deal activity from a few different perspectives in hopes of seeing it for what it truly is. Before we start spreading numbers, I want to show you how Couche-Tards details their acquisitions within their statutory financial statements.
The Company shares different amount of details, both in the footnotes to their financial statements as well as in the MD&A, based on three different deal sizes.
Above, I show examples of the two smaller deal sizes from footnotes to the Company’s 2018 financial statements. The first three bullet points are what I consider medium sized deals, Couche-Tard names the sellers, discloses store count and detail such as geography, whether land and buildings are owned or leased and if not convenience stores, what other business operations were acquired. The last bullet point is the vaguest and how The Company shares details of their smallest deals, simply listing how many stores were bought and whether land and buildings were owned and leased. Couche-Tard shares purchase prices for neither their smallest nor their medium sized deals.
Big deals are a different story. Above, I show The Company’s detailed description of their June 2012 purchase of Statoil Fuel and Retail from their 2013 MD&A. Couche-Tard shares a lot of details on their largest deals, both financial and operational. Financial details of big deals; purchase price allocation, financing mix and pro-forma results are all included in the footnotes to The Company’s financial statements.
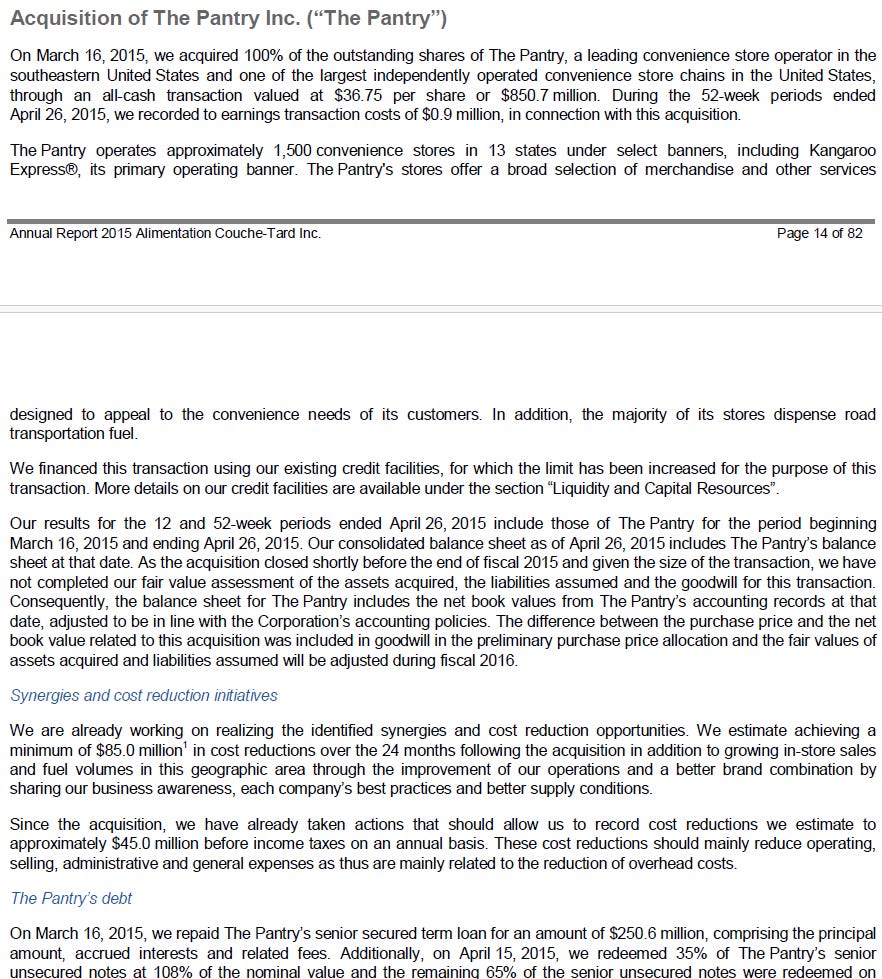
In addition to details shared in their financial statements, Couche-Tard provides even more color on their big deals in their MD&A within their Annual Reports. Above, I show The Company’s description of their March 2015 acquisition of formerly publicly traded convenience store operator, The Pantry. In the MD&As, Couche-Tard shares their initial and on-going plans for the businesses they acquire; cost savings, asset disposals and capital structure changes. We’ll dig into these post-close motions in the next section.
Let’s spread the numbers now. First by looking at dollars spent on acquisitions as a percentage of cash from operations, which I show above, both annually and cumulatively. Couche-Tard generally spends about 40% of their CFO on acquisitions. From their FY2010 - 2023, The Company spent 36.1% of the total cash from operations on acquisitions. Both percentages above are net of disposals associated with acquisitions


